Formula - Transposing/converting rows to columns- an almost impossible task?
A long-standing limitation with Power Apps is that it's very difficult to convert rows to columns, or columns to rows. Part of the problem is that there's no way to specify column names dynamically when we build output collections or tables. Therefore, the techniques available to carry out this task are always convoluted and often rely on hardcoding column and row names.
Example scenario - A use case scenario of transposing data
To give a typical use case scenario, let's take the example of the following sales data.
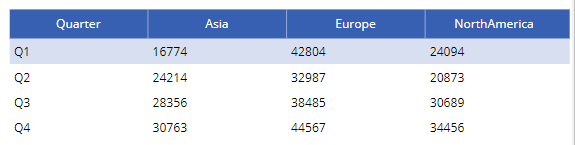
The formula beneath builds the collection (called SalesByRegion) for this example.
ClearCollect(SalesByRegion,
             {Quarter:"Q1", Europe:42804, Asia:16774 ,NorthAmerica:24094},
             {Quarter:"Q2", Europe:32987, Asia:24214 ,NorthAmerica:20873},
             {Quarter:"Q3", Europe:38485, Asia:28356 ,NorthAmerica:30689},
             {Quarter:"Q4", Europe:44567, Asia:30763 ,NorthAmerica:34456}
)
The example requirement is to transpose this data like so 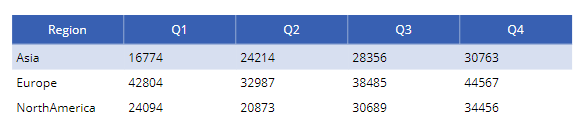
How to transpose data based on hardcoded column/row names
For this example, each row in the source table specifies the sales figures for a quarter. The columns in the source table correspond to the regions.
The target output requires us to produce a table with the column names Q1,Q2,Q3, and Q4. Since it's not possible to generate these column names dynamically, a possible solution is to construct formula that carries out the transposition, based on hard-coded values.
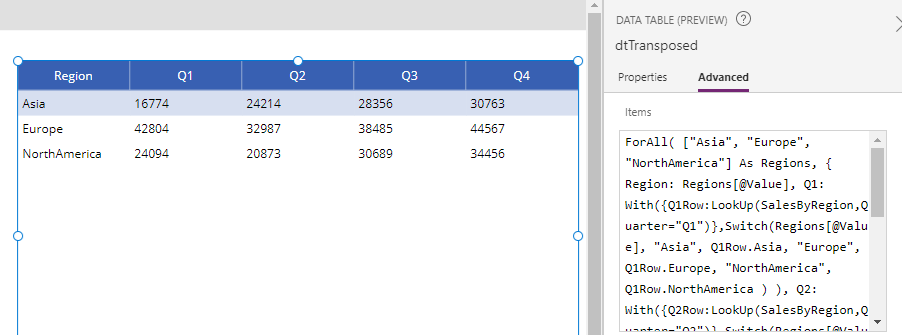
The formula beneath highlights the formula to carry out the task.
ForAll(
    ["Asia", "Europe", "NorthAmerica"] As Regions,
       {
           Region: Regions[@Value],
            Q1: With({Q1Row:LookUp(SalesByRegion,Quarter="Q1")},Switch(Regions[@Value],
                        "Asia", Q1Row.Asia,
                        "Europe", Q1Row.Europe,
                        "NorthAmerica", Q1Row.NorthAmerica
                      )
            ),
            Q2: With({Q2Row:LookUp(SalesByRegion,Quarter="Q2")},Switch(Regions[@Value],
                        "Asia", Q2Row.Asia,
                        "Europe", Q2Row.Europe,
                        "NorthAmerica", Q2Row.NorthAmerica
                      )
            ),
            Q3: With({Q3Row:LookUp(SalesByRegion,Quarter="Q3")},Switch(Regions[@Value],
                        "Asia", Q3Row.Asia,
                        "Europe", Q3Row.Europe,
                        "NorthAmerica", Q3Row.NorthAmerica
                      )
            ),
            Q4: With({Q4Row:LookUp(SalesByRegion,Quarter="Q4")},Switch(Regions[@Value],
                        "Asia", Q4Row.Asia,
                        "Europe", Q4Row.Europe,
                        "NorthAmerica", Q4Row.NorthAmerica
                      )
            )
       }
)
This produces an output table, and we apply this directly to a data control, or we could collect the results to a collection by calling the ClearCollect or Collect functions.
My Proposal - Power Apps Transpose Function
In many cases, the rows that we want to transpose into columns are unknown or can vary. Because of this, building formula with hardcoded values is not a viable solution. The only available options are to carry out the transposition outside of Power Apps, or to build complex formula based on string manipulation.
Therefore, I propose the addition of a Transpose function in Power Apps. The aim of this function is to mimic the Transpose function in Excel, and the usage would look like this:
Transpose(SalesByRegion)
The example above would return an output table with column names that derive from data.
If you would like to see this feature added to Power Apps, please vote for my idea here.
Conclusion
Transposing rows and columns in Power Apps is a difficult task. It's possible to transpose data with hardcoded column/row names and this post demonstrated a formula to carry out this task. If Power Apps provided a transpose function, this task would be much easier, and you can vote for this idea through the link in this post.