Data - How to show the distinct rows from 2 data sources or collections
A pretty common task is to show the distinct rows from 2 or more collections.
This post walks through the formula to carry out this task.
Walkthrough - Showing the distinct rows from 2 or more collections
As an example, let's take the following 2 collections - CollectionA and CollectionB.
ClearCollect(CollectionA,
  {FirstName: "Alice", Surname: "Johnson", Email: "[email protected]"},
  {FirstName: "Bob", Surname: "Smith", Email: "[email protected]"}
);

ClearCollect(CollectionB,
  {FirstName: "Bob", Surname: "Smith", Email: "[email protected]"},
  {FirstName: "Charlie", Surname: "Brown", Email: "[email protected]"}
);
With these 2 collections, Bob Smith appears in Collection A and Collection B. Therefore, the end result is to produce a collection that contains 3 records which correspond to Alice, Bob, and Charlie.
GroupBy(The screenshot beneath shows the result when we set the Items property of a data table to this formula.
Ungroup(Table(
{collection: CollectionA},
{collection: CollectionB}
),
"collection"
),"FirstName", "Surname", "Email","DistinctGroup"
)
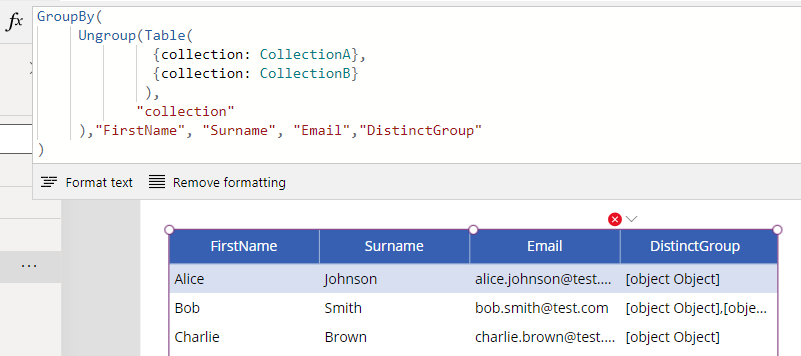
The core part of this formula calls the Table function to create a table with 2 rows - each row contains a single column called "collection" that contains the content of a collection.
The call to the Ungroup function ungroups this table by the "collection" column. The Ungroup function creates a single table that combines the content of CollectionA and CollectionB.
This ungrouped table duplicates the "Bob" record that appears in CollectionA and CollectionB. Thefore, to create an output that removes this duplication, we call the GroupBy function and specify the unique columns to show for each row - in this case, FirstName, Surname, and Email.
The GroupBy function requires us to specify a column to store any remaining columns. Here we specify the column name DistinctGroup.We can call the DropColumns function to remove this column if needed.
To create a collection to store this result, we can use the formula shown beneath.
.
ClearCollect(FinalCollection,
  DropColumns(
  GroupBy(
     Ungroup(Table(
              {collection: CollectionA},
              {collection: CollectionB}
             ),
            "collection"
     ),"Name","Email","DistinctGroup"),
    "DistinctGroup")
);
Conclusion
A common task is to show the distinct rows from multiple collections and this post walked through an example of how to do this.