Blog

What cost savings can corporate organisations achieve with Power Apps and the Power Platform?

If you're thinking of adopting Power Apps and the Power Platform in your organisation and you want to make a business case as to the potential economic benefits that the platform can add, the following Forrester studies may help you.

The other day, I received an email from Microsoft about the Forrester 2021 study - the Total Economic Impact™ of Microsoft Power Platform and Azure for Corporate IT.

For the past several years, Microsoft has commissioned these studies from Forrester, and they have been featured in their marketing and on the Power Apps Website (as shown beneath). These studies can be very useful for IT decision-makers that need to write a business case for adopting the Power Apps and the Power Platform.

Where to find these studies

We can find many of these studies by carrying out an online search on the term "Total Economic Impact of Microsoft". Here are some of the search results.

February 2021 - The Total Economic Impact of Microsoft Power Platform

March 2020 - The Total Economic Impact of Power Apps

June 2019 - The Total Economic Impact of Microsoft 365 E3

For fairness and comparison purposes, Forrester has also published similar studies for Microsoft competitors, Medix being an example.

Total Economic Impact Of The Mendix Low-Code Application Development Platform.

What do the studies tell us?

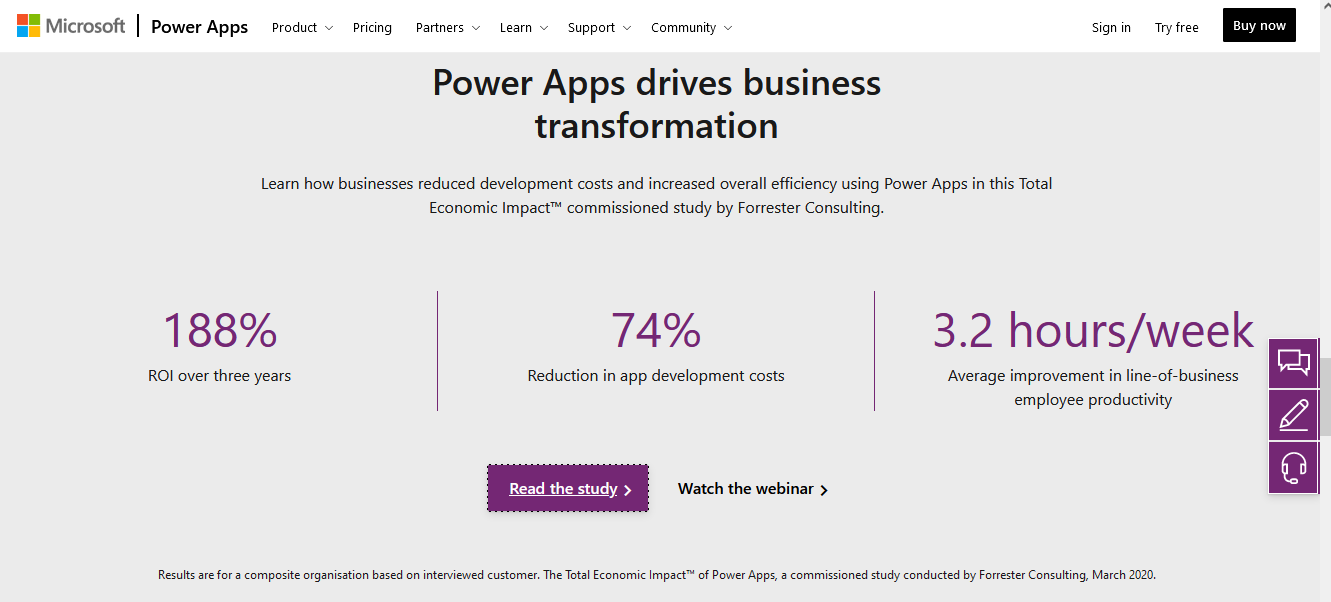
All the studies attempt to quantify the financial benefit of adopting specific technologies, and they produce compelling headline figures. The figures from the March 2020 "The Total Economic Impact of Power Apps" study (which features on the Power Apps website), boasts a 188% ROI over 3 years, and a 74% reduction in development costs.

Interestingly, the studies state a higher ROI when organisations implement solutions based on the wider Power Platform, as cited in the February 2021 study on the "Total Economic Impact of the Power Platform".  This study reports:

  • Return on Investment (ROI) of 502%
  • Net present value (NPV) $25.92
  • Application development cost reduction 48%

How are these figures derived?

These headline figures are impressive, but how are they derived?

The Power Apps study was based on interviews with 6 customers and a survey of 53 other companies. Prior to Power Apps, these companies used only "high-code" developers.

Using this data, Forrester derived a composite company with 2000 employees and 33 development projects. Therefore, the headline figures will be more accurate for organisations that match the size of this composite company.

The economic benefits were based on assessments of cost savings when building new solutions, cost savings associated with replacing existing 3rd party solutions (eg cost savings achieved by cancelling existing support and license fees), and cost savings achieved by time savings and efficiencies as a result of new apps.

Conclusion

If you're looking for guidance and structure on how to build a business case for Power Apps and the Power Platform, I would recommend the Forrester studies. Beyond the headline figures, another interesting point about the studies is that include comments and case studies from the companies that were surveyed. This content can offer practical ideas on how the Power Apps could be applied in an organisation, and provide some structure in calculating the efficiency gains that you could potentially gain in your own specific circumstances. Finally, it's important to note that these studies have been commissioned by Microsoft, so it's important to be conscious of any possible bias in the results.