Model Driven Apps - How to display an automatic Power BI view of data from data grids
This is a great feature because it enables users to very quickly explore data and to view trends, using the built-in filtering and charting capabilities in Power BI. The benefit is that there's no need for app-builders or users to pre-build Power BI reports or to navigate to a separate area in order to view the reports.
Another useful characteristic is that the data in the Power BI is connected to the data that's shown in the model driven grid. Users can filter the data in the model driven app, and the auto-generated report will be filtered by the visible data.
How to enable automatic Power BI reports in an app
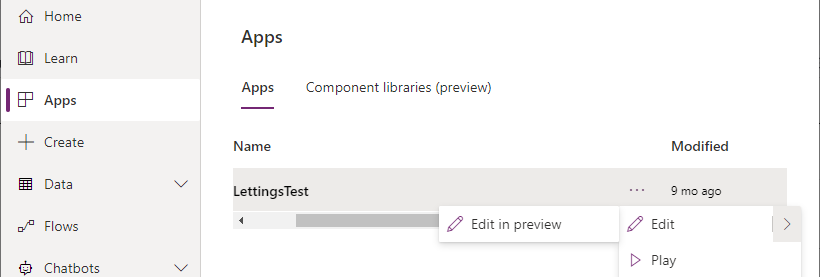
To get started, the first step is to enable this feature at an app level. We open the model driven app using the new preview designer.
Next, we navigate to the settings area and turn on the "Enable Power BI quick report visualisation on a table (preview)" setting.
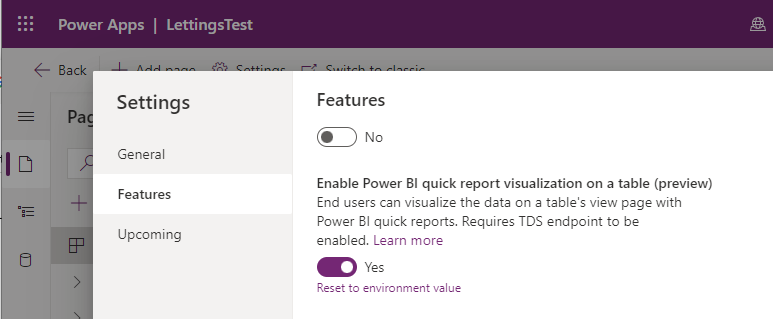
An
extra prerequisite is that we must enable the TDS endpoint at the environment level. My previous post here provides more
details of this feature.
http://powerappsguide.com/blog/post/dataverse-setup-tds-for-management-studio-powerbi
Finally, we must save and republish the app to apply the changes.
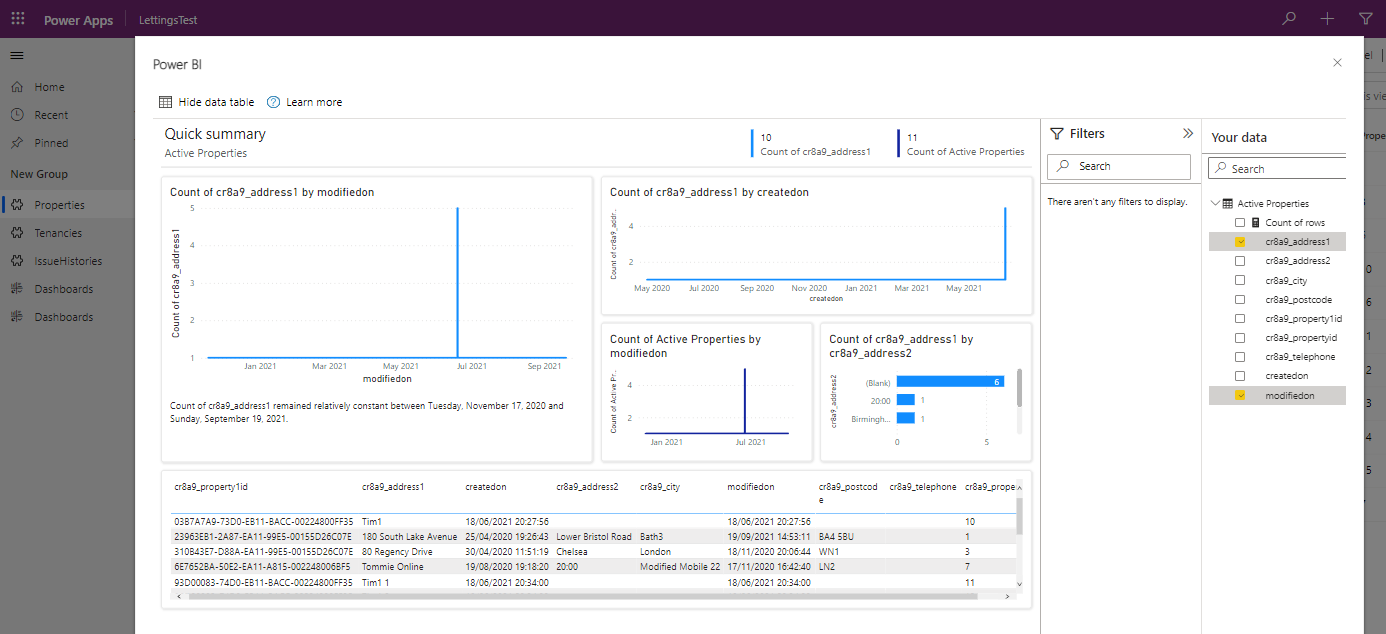
How to view Power BI report visualisations from a grid
From the model driven app, we can now open any grid view and click the "visualize this view" button that appears in the menu bar.
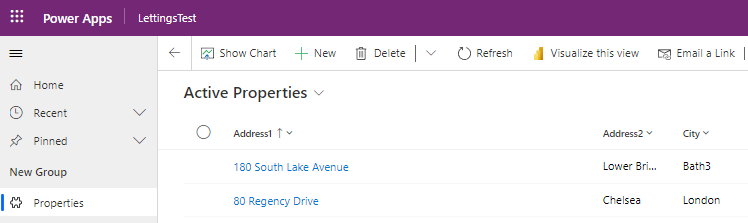
Clicking this button generates the visualisation, which can take
several seconds. The output then appears in a panel. The report includes auto-generated charts and tabular views of the data.