Monitor tool - An introduction to how to use monitor, and what it can do
Whenever we encounter bugs or problems with our apps, particularly those around performance, Monitor is the first tool that we should turn to. It works both with apps that we're developing or apps that are published. This post introduces the features that are available through Monitor.
Summary of features
Monitor can trace the full activity of a Power Apps session. It records button clicks, the value of variables, the details of HTTP calls - effectively, everything that a user caries out.
An excellent use-case scenario of Monitor is to review data access activities, including the filter criteria and the records that a data service (eg SharePoint/SQL Server/etc) returns. This type of tracing can help diagnose performance or delegation issues.
There are at least four ways to use Monitor:
There are at least four ways to use Monitor:
- We can use Monitor whilst we're developing an app. This can help diagnose issues such as record retrieval problems that are assoicated with delegation limits, or slow performance.
- For published apps, an end user can share a Monitor session with us (the app builder). This enables us to see what a user is doing, and to diagnose problems that an end user experiences.
- When we build an app, we can invite colleagues or more experienced app builders to a Monitor session. This can provides a means to receive technical support.
- We can export the contents of a Monitor session to a file, and re-import it into a subsequent Monitor session. We can use this to save activity details, and it also provides an another way for end users to share trace details with app builders, particularly in cases where an app-builder belongs to a different organisation or tenant.
How to start a Monitor session
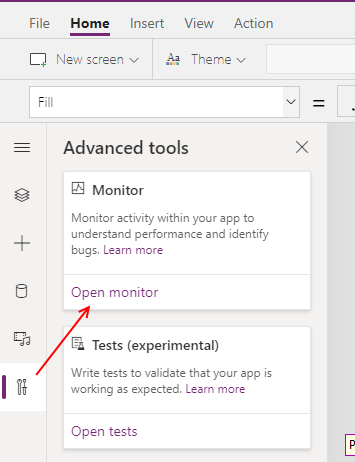
To demonstrate the basic use of Monitor, we can start monitor by editing an app and using the 'Advanced tools' section in left hand panel. This opens a Monitor session in a separate window. At this point, we can run and carry out actions in our app, and the Monitor session in the separate window will record the activity.
The screenshot beneath illustrates what we see in the Monitor window. A list of activities will appear in the main body of the window. In this example, we see the network operations that are related to the data population of a gallery control.
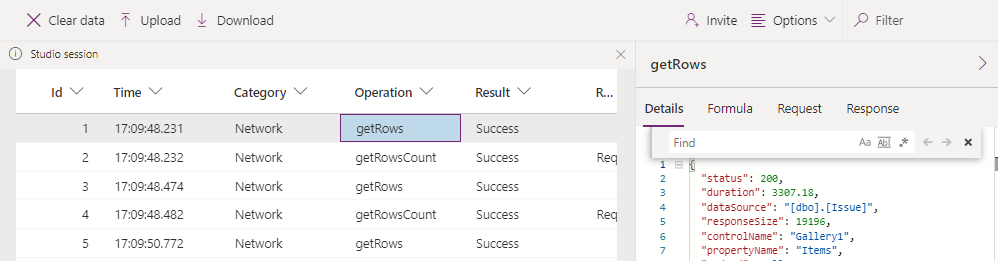
The notable features in the Monitor window include:
- We can select a row in the trace and view the details in the right-hand pane. In the case of a network call, this includes the calling Power Apps formula, the request to the data service, and the response/records that the data service returns.
- We can click the download button to save the trace. At a later point in time, we can re-load the trace by clicking the upload button.
- We can click the invite button to share a Monitor session with another user (we would use this if we want to request technical support from another user).
How end-users can start and share Monitor sessions
The other significant use case scenario of Monitor is to allow end-users of published apps to share a Monitor session with the app builder. This enables app builders to provide technical support and to see the actions that a user carries out, leading up to the problem.
A pre-requisite of this method is to enable the 'debug published app' setting in the settings of an app. We must republish an app for this setting to take effect.
A pre-requisite of this method is to enable the 'debug published app' setting in the settings of an app. We must republish an app for this setting to take effect.
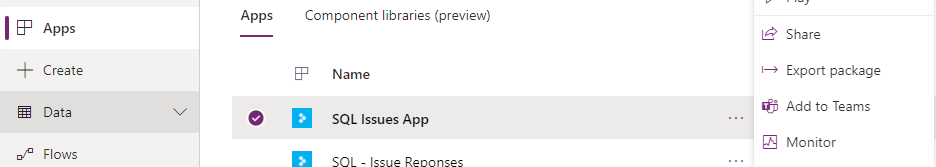
To start a Monitor session, the end user selects the Monitor menu item from the context menu of an app in the app list.
When the Monitor session begins, the user can click the invite button to share the session.This button enables the user to send invitations by email address. This process generates a web link that opens the shared Monitor session for the invitee. The user can send this web link by email, or some other means.
When the invitee(s) have joined the Monitor session, the user begins by clicking the play published app button. Any activity that the user initiates through this session will appear in the trace.
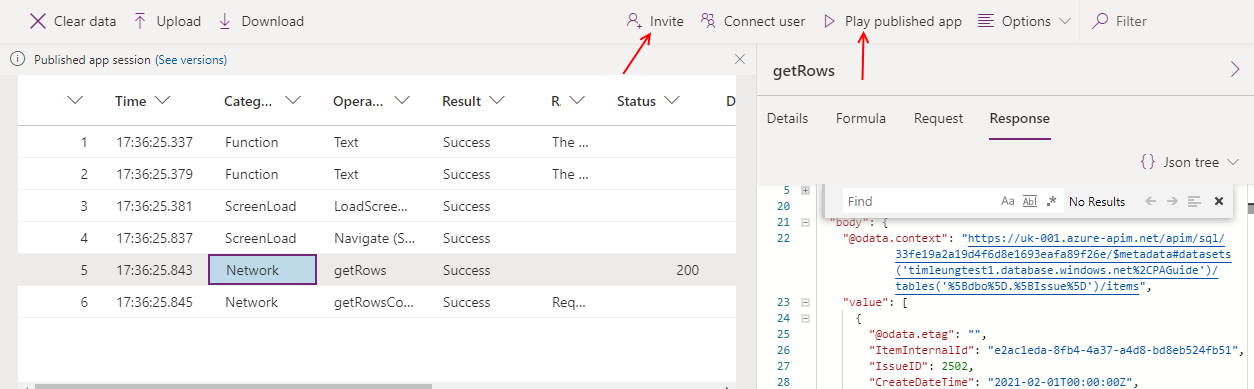
The app build can then use the details of the trace to see what is happening, and to diagnose the problems.
Conclusion
Monitor is a valuable tool that helps debug and to trace problems with apps. App builders use the Monitor tool whilst building an app, and end-users can invite app-builders to a Monitor session to help identify problems with published apps.